Wednesday, December 22, 2010

Season's Greetings 2010

As the last post for 2010, from my original home Downunder, I would just like to thank all my readers and Guerrilla class alumni during this holiday season (whichever one you celebrate) and offer you my best wishes for success in the new year.

The Melbourne office of Performance Dynamics in Australia

Unfortunately, computer performance analysis and capacity planning doesn't extend to improving the weather in the northern hemisphere. All hate-mail should be sent to Prime Minister Julia Gillard.

Saturday, November 13, 2010

Reporting Standard Errors for USL Coefficients

In a recent Guerrilla CaP Group discussion, Baron S. wrote:
....
BS> Using gnuplot against the dataset I gave, I get 
BS>    sigma   0.0207163 +/- 0.001323 (6.385%) 
BS>    kappa   0.000861226 +/- 5.414e-05 (6.287%) 
The Gnuplot output includes the errors for each of the universal scalability law (USL) coefficients. A question about the magnitude of these errors also arose in a recent talk I gave. Typically, this question doesn't come up because there's more focus on assessing the residual errors as a measure of fit for the USL against the data set. Also, statistical accuracy can be a bigger issue when there are only a small number of samples. Barron reported 32 data points, so that's not an problem in this case.

Monday, November 8, 2010

Efficient Elevators: Algorithms, Cars and Queues

The latest PBS NOVA episode entitled "Trapped in an Elevator" is based on an actual event that occurred in 1999. Watching it reminded me that elevators (or lift in British english) can be regarded as a queueing system, viz., priority queues, which are also the basis for scheduling algorithms in operating systems and storage devices. A lot of this background can be found in Don Knuth's erudite volumes:
  • Vol 1, p.280: elevator simulator program based on doubly-linked lists
  • Vol 3, p.150: elevator scheduling as priority queues
  • Vol 3, p.357: tape sorting reformulated as single elevator problem
  • Vol 3, p.374: disk seeks treated as single elevator problem


[Best wishes for Randall's fiancée]

Saturday, November 6, 2010

Cooking Up Some Hotsos for 2011

Just got word that my proposed presentation "Brooks, Cooks and Response Time Scalability" has been accepted for the Hotsos Symposium, March 2011 in Dallas, Texas.
Hotsos is a great conference that is Oracle-related but not Oracle-sponsored. As the name implies, the focus is on the performance of Oracle databases and applications, but it's been my experience that attendees are very keen to know about performance techniques, not matter what their context.

Hotsos 2011 will give me an opportunity to expand on my Nov 2007 observation that the USL contains a representation of the mythical man-month. In other presentations I've always talked about characterizing throughput scalability, but this time I'll extend the USL to quantifying response-time scalability.

Tuesday, October 5, 2010

Plan for Guerrilla Capacity Planning in November

You can still pile into the final Guerrilla Capacity Planning (GCaP) class for 2010 at the Early Bird rate. Before signing up, you can review the highlights of the May GCaP class. If you came to the August GDAT class, but missed the previous GCaP class, here is your chance to catch up.

Entrance Larkspur Landing hotel Pleasanton California

As usual, it will be held at our lovely Larkspur Landing location. Click on the image for booking information.

Attendees should bring their laptops, as course materials will only be provided on CD or flash drive. We will be distributing free notepads so you can also take hand-written notes. The venue also has free wi-fi to the internet.

Tuesday, September 7, 2010

Confidence Bands for Universal Scalability Models

In the recent GDAT class, confidence intervals (CI) for performance data were discussed. Their generalization to confidence bands (CB) for scalability projections using the USL model also came up informally. I showed a prototype plot but it was an ugly hack. Later requests from GDAT attendees to apply CBs to their own data meant I had to do something about that. I tried a lot of things in R that didn't produce the expected results. Ultimately, I was led to explore the ggplot2 package—the "gg" stands for grammar of graphics. A set of ggplots, corresponding to the VAMOOS stages of USL analysis, is shown in Figure 1.

Monday, August 30, 2010

Where to Start with PDQ?

Once you've downloaded PDQ with a view to solving your performance-related questions, the next step is getting started using it. Why not have some fun with blocks? Fun-ctional blocks, that is.

Since all digital computers and network systems can be considered as a collection of functional blocks and these blocks often contain buffers, their performance can be modeled as a collection of buffers or queues. Therefore, start developing your PDQ model by drawing a functional block diagram of the relevant architecture using elements like these:

Wednesday, August 25, 2010

Excel Errors and Other Numerical Nightmares

Although I use Excel all the time, and I strongly encourage my students to use it for performance analysis and CaP, I was forced to include a warranty disclaimer in my GCaP book because I discovered a serious numerical error while writing Appendix B. There, my intention was just to show that Excel gives essentially the same results as Mathematica when using the USL scalability model. It didn't!

Monday, August 16, 2010

Gone Guerrill_ R on Our Data

Here's a summary of some things we learnt about applying R to computer performance and capacity planning data in the GDAT Class last week.
  • Neural nets pkg nnet applied to CPU performance data in the Ripley and Venables book (see Section 8.10).
  • How to do stacked plots that Jim calls "spark plots."
  • Jim told us that ggplot has a nice GUI but considerably slower than using the base plot routines.
  • Use of POSIXct to convert timestamps.
  • Handling multi-line headers.
  • Handling multi-word fields in headers.
  • To make getwd() like the UNIX shell command: pwd<-function(){cat(getwd())}.
  • Think of lapply as a vectorized for-loop.
  • Calculating confidence intervals, which David explained earlier in the week, is available as the CI function in gmodels pkg on CRAN.
  • Fourier Transform Your Data. This was done using Mathematica but the same thing can be accomplished with the fftw pkg on CRAN.
  • VAMOOS your data.
If you want to learn things like this, then consider putting this GDAT class on your calendar for next year.

Thursday, August 12, 2010

GDAT: Fourier Transform Your Data

The Fourier theorem essentially states that any arbitrary continuous function can be constructed by adding together sine and cosine functions with appropriately chosen amplitudes, frequencies and phases. This is what distinguishes two musical instruments, e.g., a violin and a trumpet, when they are both tuning to the same concert-A pitch. Each is playing the same fundamental frequency (440 Hz) but the higher harmonics; the additional sines and cosines overlaid on top of that fundamental tone, are what allows your ear to distinguish the violin sound from the trumpet sound.

Here is a nice little video demonstration of the Fourier theorem in action using a Hammond B3 electronic organ—an instrument capable of mimicking other instruments through the use of the Fourier theorem.

What would happen if we tried to apply the Fourier theorem to performance or capacity planning data?

Wednesday, August 11, 2010

GDAT Visualization: Black Friday at eBay

This animated heatmap visualization of Black Friday transaction volumes at eBay


was brought to our attention in the GDAT class today, compliments of Matt C. from PayPal.

Sunday, August 1, 2010

Florence Nightingale was a Statistician

Florence Nightingale was elected the first female member of the Royal Statistical Society in 1859 and she later became an honorary member of the American Statistical Association. She also travelled with a pet owl in her pocket. [Source: Graham Farmelo]


Moreover, she was also a pioneer in data visualization by virtue of developing a form of pie chart known today as the polar area diagram.

Sunday, July 25, 2010

World Datacenter Storage at 1 ZB

Heard on the BBC World Service:
"The world is drowning in a sea of data. Facebook users alone are uploading more than a thousand photos a second. We're now seeing an exponential explosion of information. So how much information are we really storing?"

Monday, July 5, 2010

Go Guerrill-R on Your Data in August

Only one month to go! Register now for the Guerrilla Data Analysis Techniques (GDAT) class to be held during the week of August 9-13, 2010. The focus will be on using R and the PDQ-R for computer performance analysis and capacity planning.


(Click on the image for details)

For those of you coming from international locations, here is a table of currency EXCHANGE rates. We look forward to seeing all of you in August!

Prime Parallels for Load Balancing

Having finally popped the stack on computing prime numbers with R in Part II and Part III, we are now in a position to discuss their relevance for computational scalability.

Friday, June 25, 2010

Velocity 2010 The Aftermathglow

I was so impressed with Velocity 2009, I really wanted to present something at Velocity 2010.

Velocity 2010 Conference
Thread-limited scalability of memcached

Working with Shanti and Stefan of Oracle (née Sun Microsystems), I was able to accomplish that goal. Our session was rated 92.4%, which is an A+ in anyone's books. Congrats to us and the Velocity organizers and thank you, crowd.

Tuesday, June 22, 2010

Linear Modeling in R and the Hubble Bubble

Here is a scatter plot with the coordinate labels deliberately omitted.


Figure 1.

Do you see any trends? How would you model these data?

Monday, June 21, 2010

Memcached and Friends at Velocity 2010

This is the week. Starts tomorrow and it's sold out!

Velocity 2010 Conference
Click on the image for details

Shanti and I will be presenting at 1300 on Thursday. The Velocity conference is being held at the Hyatt Regency Santa Clara, near Great America.

Thursday, June 17, 2010

Playing with Primes in R (Part II)

Popping Part III off the stack—where I ended up unexpectedly discovering that the primes and primlist functions are broken in the schoolmath package on CRAN—let's see what prime numbers look like when computed correctly in R. To do this, I've had to roll my own prime number generating function.

Sunday, June 13, 2010

Primes in R (Part III): Schoolmath is Broken!

Here we are in Part III. Wait!? What happened to Parts I and II? Well, I started to write an article about Amdahl's law, parallelism and prime numbers, but found myself buried three levels deep trying to resolve problems with prime numbers in R. My normal inclination is to use Mathematica for such things, but I happened to already be using R for another reason so, I thought I'd see what it had to offer for calculating with primes. It now looks like that might have been a mistake.

Tuesday, June 8, 2010

Go Guerrill-R on Your Data in August

Guerrill-R, get it? Register now for the Guerrilla Data Analysis Techniques (GDAT) class to be held during the week of August 9-13, 2010. The focus will be on using R and the PDQ-R for computer performance analysis and capacity planning.


(Click on the image for details)

For those of you coming from international locations, here is a table of currency EXCHANGE rates. We look forward to seeing all of you in August!

Sunday, June 6, 2010

Calculating the Cost of Elastic Capacity

Neal Richter sent me the following tweet
neal richter tweet
Unfortunately, the paper ("Optimal staffing policy for queuing systems with cyclic demands," Int. J. Services and Operations Management, 2010) cited in the PhyOrg news item, that Neal tweeted, is not accessible to either him or me. Nonetheless, I found an earlier paper (2007) by the same author (Pen-Yuan Liao), which has a lot of the same words so, I'm assuming they both describe the same thing, more or less. Either way, I'm quite certain the math is the same.

Sunday, May 30, 2010

Simulating a Queue in R

In the GCaP class earlier this month, we talked about the meaning of the load average (in Unix and Linux) and simulating a grocery store checkout lane, but I didn't actually do it. So, I decided to take a shot at constructing a discrete-event simulation (as opposed to Monte Carlo simulation) of a simple M/M/1 queue in R.

Saturday, May 22, 2010

Jackson's Theorem for the Cloud

Queueing theory, as a distinct discipline, just turned 100 last year. Compared with mathematics and physics, it's a relative youngster. Some seminal results include: Erlang's original solution for the M/D/1 queue (1909), his solutions for a multiserver queue without a waiting line M/M/m/m and with a waiting line M/M/m/∞; AKA "call waiting" (1917), the Pollaczek–Khinchine formula for the M/G/1 queue (1930) and Little's proof (1961). These results were established in the context of individual queueing facilities.

Thursday, May 20, 2010

Load Testing Think Time Distributions

One of my gripes about some commercial load testing tools is that they only provide a think time distribution (Z) that is equivalent to uniform variates in the client-script. If you want some other distribution, you have to code it and debug it yourself. Load test generators are essentially very expensive workload simulators; especially when you take into account the cost of the SUT platform. At those prices, a selection of distributions should be provided as a standard library—like they are in event-based simulators.

To make this point a bit clearer, I used the very convenient variate-generation functions in R to compare some of the distributions that I consider should be included in such a library for the convenience of workload-test designers and performance engineers. The statistical mean (i.e., the average think delay) is the same in all these plots and is shown as the red vertical line, but pay particular attention to the spread around the mean on the x-axis.

Tuesday, May 18, 2010

Intel's Cloud Computer on a Chip

Last week in the GCaP class, I underscored how important it is to "look out the window" and keep an eye on what is happening in the marketplace, because some of those developments may eventually impact capacity planning in your shop. Here's a good example:

This Intel processor (code named "Rock Creek") integrates 48 IA-32 cores, 4 DDR3 memory channels, and a voltage regulator controller in a 6×4 2D-mesh network-on-chip architecture. Located at each mesh node is a five-port virtual cut-through packet switched router shared between two cores. Core-to-core communication uses message passing while exploiting 384KB of on-die shared memory. Fine grain power management takes advantage of 8 voltage and 28 frequency islands to allow independent DVFS of cores and mesh. At the nominal 1.1V, cores operate at 1GHz while the 2D-mesh operates at 2GHz. As performance and voltage scales, the processor dissipates between 25W and 125W. The 567 sq-mm processor die is implemented in 45nm Hi-K CMOS and has 1,300,000,000 transistors.
The "cloud" reference is a marketing hook, but note that it uses a 2D mesh interconnect topology (like we discussed in class), contains 1.3 billion transistors with the new Hafnium metal gate (as we discussed in class), and produces up to 125 watts of heat.

The details of this processor were presented at the annual ISSCC meeting in San Francisco, February 2010.

Saturday, May 15, 2010

Emulating Web Traffic in Load Tests

One of the recurring questions in the GCaP class last week was: How can we make web-application load tests more representative of real Internet traffic? The sticking point is that conventional load-test simulators like LoadRunner, JMeter, and httperf, represent the load in terms of a finite number of virtual user (or vuser) scripts, whereas the Internet has an indeterminately large number of real users creating load.

Friday, May 14, 2010

GCaP Class Highlights

It was sunny outside but we ended up staying in the shade for better lighting balance. Other grads had to catch earlier flights home by the time this shot was taken.

GCaP grads 2010
Some graduates of the May 2010 GCaP class. Photo courtesy Manu M.

Here are some of the interesting topics that popped up in class discussions this week:This is why you too should consider attending an upcoming Guerrilla class.

Monday, May 10, 2010

BRL-CAD Benchmark and USL Modeling

MariuszW asked a question in a previous post entitled This is Your Measurements on Models. Since answering it is rather involved, I decided to address it here as a separate blog post. The context of the question concerns the application of my universal scalability model (USL).
"I understand that system characteristic is in α and β and the interpretation is the key. And that there is aggregation. In GCaP [book] (in table 5.1) there are ray tracing benchmark results - what is workload (users, tasks) described in such case? Numbers? Is it Xmax on given processor in this table? - so processor p1 is loaded to measure Imax, next p4 is loaded to measuer Imax? - isn't task or user number important for given p-Imax?"

Sunday, May 9, 2010

Using Think Times to Determine Arrival Rates

This question came up at the NorCal CMG meeting last week. Hugh S. asked me: Is there is a relationship between the choice of think time (Z) in a load-test client script and the rate at which requests will arrive into the system under test? The answer is, yes, and it's easy to understand how by using the preceding blog post about mapping virtual users to real users.

Mapping Virtual Users to Real Users

In performance engineering scenarios that use commercial load testing tools, e.g., LoadRunner, the question often arises: How many virtual users (vusers) should be exercised in order to simulate by some expected number of real users? This is important, more often than not, because the requirement might be to simulate thousands or even tens of thousands of real users, but the stiff licensing fees associated with each vuser (above some small default number) makes that cost-prohibitive. As I intend to demonstrate here, we can apply Little's law to map vusers to real users.

A commonly used practical approach to ameliorate this circumstance is to run the load test scenarios with zero think time (i.e., Z = 0) in the client scripts on the driver (DVR) side of the test rig. This choice effectively increases the number of active transactions running on the system under test (SUT), which might include apps servers and database servers. These two subsystems are usually connected by a local area network, as shown in the following diagram.

Friday, April 16, 2010

Significant Figures in R and Rounding

This is a follow-on to my previous post about determining significant digits or sigdigs, in performance and capacity management calculations. See Significant Figures in R and Info Zeros

Once we know how to identify significant digits, inevitably we will be faced with rounding the result of a calculation to the least number of sigdigs. Whereas the signif() function in R suffered from truncating trailing info-zeros in measured values, when it comes to rounding, signif shines. Better yet, it agrees with the Algorithm 3.2 in my GCaP book. Let's see how well it does.

Sunday, April 11, 2010

Significant Figures in R and Info Zeros

The other day, I stumbled upon the signif function in R, so I thought I'd take a look at what it does and compare it with some results discussed in Chap. 3 "Damaging Digits in Capacity Calculations" of my GCaP book, viz., Example 3.5 on page 31. The measured numbers in that example are reproduced here in Table 1 using read.table in R.

Thursday, April 8, 2010

Plan for Guerrilla Capacity Planning in May

The next set of Guerrilla classes are coming up in May and seats are still available. Book early, book often. Update: Erm ... let me qualify that. The "Boot Camp" class is now closed, but the "Capacity Planning" class running the week of May 10 is still open.

Entrance Larkspur Landing hotel Pleasanton California
Blast from the past. Some members of the 2006 class. Courtesy Tony Aponte

For those of you coming from international locations, here is a table of currency exchange rates.
Entrance Larkspur Landing hotel Pleasanton California
(Click on the image for more details)

All Guerrilla classes have a certification level 1, 2, 3, but there are no prerequisites at this time.

Sunday, March 21, 2010

Bandwidth vs. Latency — The World is Curved

Despite what you may have read in the press lately, neither our world nor the world of performance is flat. This is especially true of the performance metrics commonly known as bandwidth (or throughput) and latency. The performance relationship between these two metrics is curved or nonlinear. In general, this nonlinearity is a consequence of these two metrics being inversely related to each another: increase system throughput to decrease the latency of each request, and vice versa. A common misconception persists, however, that bandwidth and latency are independent performance metrics. I'm going to call that view the Flat-Earth view. Where does that view come from?

Window on the World

In part, it depends on your window to the world. When we look out a window, the Earth looks flat.

Occasionally, we are reminded that the Earth is actually curved. That's something most of us accept and expect, even if we're not aware of it all of the time.

Friday, March 19, 2010

Memcached Scalability at Velocity 2010

Totally stoked about being selected for the Web Performance track at Velocity 2010.

Velocity 2010 Conference

Here's our abstract:
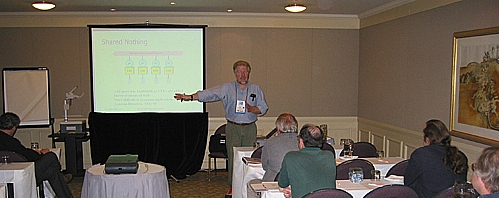
Hidden Scalability Gotchas in Memcached and Friends


Neil Gunther (Performance Dynamics), Shanti Subramanyam (Oracle Corporation), Stefan Parvu (Sun Microsystems)

Most web deployments have standardized on horizontal scaleout in every tier—web, application, caching and database—using cheap, off-the-shelf, white boxes. In this approach, there are no real expectations for vertical scalability of server apps like memcached or the full LAMP stack. But with the potential for highly concurrent scalability offered by newer multicore processors, it is no longer cost-effective to ignore their underutilization due to poor, thread-level, scalability of the web stack. In this session we show you how to quantify scalability with the Universal Scalability Law (USL) by demonstrating its application to actual performance data collected from a memcached benchmark. As a side effect of our technique, you will see how the USL also identifies the most signficant performance tuning opportunities to improve web app scalability.

Thursday, March 11, 2010

Human Metro Map and Performance Management

In my Guerrilla classes, I like to compare making a computer performance model (e.g., in PDQ) with model train construction. In the latter case, the goal is to make a scaled replica that includes as much realistism as possible (Aside: I'm assuming this is true, since I have no interest in making model trains). The goal for a performance model is the exact opposite, viz., to throw away as much detail as possible, while still maintaining the essential performance characteristics of the real computer system.

This notion leads to Guerrilla Mantra 2.4:

A performance model is more like a map of a metro rail system than a scaled replica of the metro railway.

Quantum Camera Cited in HP Labs Annual Report

HP Labs Annual Report

The joint work we published last year on quantum information processing, in New Journal of Physics and Optics Express, has been cited on p. 29 of the 2009 HP Labs Annual Report.

Friday, February 19, 2010

Guerrilla Boot Camps Coming Up

Time to start thinking about getting approval for Guerrilla training in 2010. How to do more with less.

Seminar room Larkspur Landing hotel Pleasanton California
(Click on the image for more details)

Upcoming options:
  1. Two-day, entry-level Guerrilla Boot Camp runs Mar 25-26
  2. Back-2-back Boot Camp and full Guerrilla CaP course runs May 6-14
All Guerrilla classes have a certification level 1, 2, 3, but there are no prerequisites at this time. For those of you coming from international locations, here is a table of currency exchange rates.

We look forward to seeing all of you here!

Friday, February 5, 2010

Guerrilla Mantras Now Updated on Twitter

Those of you in the trenches carrying out performance analysis and capacity planning, perhaps doing it off your own bat, often find yourself in the position where you wish you could point quickly to a more authoritative list of reasons in support your goals. It can mean the difference between convincing your management or not.


To this end, the Guerrilla Manual is provided as a pull-out booklet in the rear jacket of my Guerrilla Capacity Planning book. Now, for an even more rapid-fire response, Guerrilla mantras (140 characters or less) are automatically posted on Twitter. Look for the GMantra tag.

Wednesday, February 3, 2010

A4 (ain't just paper anymore): Apple's New Chip

In case you missed it, with the advent of the iPad, Apple Inc. has entered the CPU business. While many pundits are still scratching their heads and wondering, "Who needs a giant iPod Touch?" Chris O'Brian notes:

"For the first time, Apple has built it’s own chip for a product. For years, the company has worked with others, first Motorola and then IBM, to build its processors. But for the iPad, the company debuted its A4 chip. The chip came via its acquistion of P.A. Semi in 2008. Building its own chip reportedly was one of the key reasons Apple was able to bring the cost of the iPad down. But early reviewers have also noted the iPad’s speed at rendering Web pages. The A4 potentially puts Apple in a position to build more of its own chips, and it also sets up a new rivalry against Intel for the mobile computing business."

Apple has built chips before; he means home-grown microprocessor.

Tuesday, February 2, 2010

NorCal ORACLE User Group Meeting

The 2010 Winter noCOUG Conference will be held at the CarrAmerica Conference Center in Pleasanton, California, on Thursday, February 11, 2010. Attendance is $50 for non-members. If you're planning to attend, then you will need to RSVP online.

I will be presenting both:

Monday, February 1, 2010