"Can someone tell me what skill set should a Performance and Capacity Analyst have and develop throughout his career?"and I realized that, although I have a kind of list in my head, and I talk about such skills in my classes, I have been too lazy to write them down anywhere; which is pretty dumb. I must try to do something about that (New Year resolution? What are the odds?). In some ways, my fallback is the online Guerrilla Manual. Anyway, here is my (slightly edited) response to the LI question, and let it therefore constitute my first attempt at writing down such a list.
Tuesday, December 27, 2011
A List of CaP Skills
This question popped up recently on Linkedin:
Monday, December 19, 2011
Season's Greetings 2011
Best wishes to all my blog readers and Guerrilla class alumni during this 2011 holiday season. I look forward to more of the same next year.
 Image: The winter lights of Silicon Valley, California, from Mt. Hamilton webcam courtesy of UC Regents and Lick Observatory.

Monday, October 24, 2011
Webinar: Load Testing Meets Data Analytics
This Thursday, October 27 at 10 am PDT*, I'll be participating in a webinar sponsored by SOASTA, Inc. They make a
new breed of load-testing product called CloudTest® which, despite its name, is not restricted to load testing cloud-based apps, although it can do that too.
Thursday, October 20, 2011
Kanban Revived in an Agile Kind of Way
I just returned from a workshop on the latest in web technologies (invitation only) where I was surprised to hear reference made to kanban. Kanban is a card-based system originally developed by Toyota in the 1950s for controlling their manufacturing lines. I have a note about it in the "Brief History of Buffers" section of my Perl::PDQ book because it is a logical precursor to JIT scheduling and compiling. I will also discuss it in the up-coming Guerrilla classes.
Now, it seems kanban has been revived under the "agile" banner for making software development more efficient. Of course, the concept of using cards to capture dev state information is not entirely new, even in the context of software engineering. So-called Snow Cards are another card-based technique used to monitor the software development process.
Monday, October 3, 2011
Visual Illusions: Google vs Facebook vs Yahoo
The ability to visualize data, enabled by the advent of graphical computer tools, has been a great boon to Cap and Perf. The power derives from the way graphical displays provide an efficient impedance match to the visual system in our brain. The weakness derives from the way graphical displays provide an efficient impedance match to the visual system in our brain. We can get carried away by visual representations alone. Every marketing organization exploits that weakness. Numbers do have poor cognitive impedance, but that doesn't mean numbers should ignored altogether. In fact, we often need a combination of both numerical and visual data representations so that we don't suffer visual miscues and thus jump to the wrong conclusion. The following presents an example of how easily this can happen.

Recently, Guerrilla alumnus, Scott J. pointed me at this Chart of the Day showing how Google revenue growth was outpacing both Facebook and Yahoo, when compared 7 years after launching the respective companies.

Clearly, this chart is intended to be an attention getter for the Silicon Alley Insider website but, it looks about right and normally I might have just accepted the claim without giving it anymore thought. The notion that Google growth is dominating, is also consistent with a lot of other things one sees. No surprises there.
Monday, September 12, 2011
Plan for GCaP in November
Seats are still available for the final Guerrilla Boot Camp (GBoot) and
Guerrilla Capacity Planning (GCaP) classes for 2011 at the Early Bird rate. Before registering, you can review the highlights of the May GCaP class. If you came to the August GDAT class, but missed the May classes, this is your chance to complete the set.

As usual, it will be held at our lovely Larkspur Landing location. Click on the image for booking information.
Attendees should bring their laptops, as course materials are provided on CD or flash drive. The venue also offers free wi-fi to the internet.
As usual, it will be held at our lovely Larkspur Landing location. Click on the image for booking information.
Attendees should bring their laptops, as course materials are provided on CD or flash drive. The venue also offers free wi-fi to the internet.
Tuesday, September 6, 2011
How Much Wayback for CaP?
How much data do you need to retain for meaningful capacity planning and performance analysis purposes? Sounds like one of those "how long is a piece of string?" questions and I've never really thought about it in any formal way, but it occurred to me that 5 years is not an unreasonable archival period.

Mister Peabody and Sherman in front of the WABAC machine
My reasoning goes like this:

My reasoning goes like this:
Tuesday, August 23, 2011
Subjugation to the Sigmas
No doubt you've heard about the tyranny of the 9s in reference to computer system availability. You're probably also familiar with the phrase six sigma, either in the context of manufacturing process quality control or the improvement of business processes. As we discovered in the recent Guerrilla Data Analysis Techniques class, the two concepts are related.
In this way, people like to talk about achieving "5 nines" availability or a "six sigma" quality level. These phrases are often bandied about without appreciating:
| Nines | Percent | Downtime/Year | σ Level |
| 4 | 99.99% | 52.596 minutes | 4σ |
| 5 | 99.999% | 5.2596 minutes | - |
| 6 | 99.9999% | 31.5576 seconds | 5σ |
| 7 | 99.99999% | 3.15576 seconds | - |
| 8 | 99.999999% | 315.6 milliseconds | 6σ |
In this way, people like to talk about achieving "5 nines" availability or a "six sigma" quality level. These phrases are often bandied about without appreciating:
Wednesday, August 17, 2011
IBM Introduces the Cognitive Chip
Last week, in the GDAT class, we were discussing performance visualization tools as requiring a good impedance match between the digital computer under analysis and the cognitive computer of the analyst—AKA the brain.


Saturday, August 13, 2011
GDAT 2011 in Review
As usual, the Guerrilla Data Analysis Techniques (GDAT) class was a total blast. Motivated students always guarantee that. It would really help our scheduling, however, if people didn't wait until the last nanosecond to register for the class. But given the crazy economic climate, I'm more than happy to do whatever it takes to make GDAT fly.
Some course highlights that you missed:
Some course highlights that you missed:

Wednesday, August 3, 2011
Q-Q Plots and Power Laws in Database Performance Data
I'm in the process of putting together some slides on how to apply Quantile-Quantile plots to performance data. Q-Q plots are a handy tool for visually inspecting how well your data matches a known probability distribution (prob dsn). If the match is good, the data should line up more or less diagonally in the Q-Q plot. A common usage is to verify normality, i.e. how well the data matches a Normal or Gaussian dsn. In fact, this usage is so common that R even has a separate function called qqnorm() for doing just that.
Sunday, July 10, 2011
The Multiserver Numbers Game
In a previous post, I explained why
\begin{equation}
R_m \neq \dfrac{R_1}{m} \label{eqn:badest}
\end{equation}
and therefore doesn't work as an estimator of the mean residence time in an M/M/m multi-server queue. Although we expect the extra server capacity with m-servers to produce a shorter residence time ($R_m$), it is not m-times smaller than the residence time ($R_1$) for a single-server (i.e., $m = 1$) queue.
 M/M/m multiserver queue
M/M/m multiserver queueThe problem is that eqn. \eqref{eqn:badest} grossly underestimates $R_m$, which is precisely the wrong direction for capacity planning scenarios. For that purpose, it's generally better to overestimate performance metrics. That's too bad because it would be a handy Guerrilla-style formula if it did work. You would be able do the calculation in your head and impress everyone on your team (not to mention performing it as a party trick).
Given that eqn. \eqref{eqn:badest} is a poor estimator, you might wonder if there's a better one, and if you'd been working for Thomas Edison he would have told you: "There's a better wsy. Find it!" Easy for him to say. But if you did decide to take up Edison's challenge, how would you even begin to search for such a thing?
Saturday, July 2, 2011
Little's Lore
Guerrilla alumnus Paul P. has a penchant for sending me interesting things, and recently he sent me a piece on Little's law. Remarkably, it wasn't just another proof of L = λW, but a brief retrospective written by none other than John Little himself. I quote it here because it not only provides some unusual insight into how these things get done, but it is written in a charming and self-effacing style.


Tuesday, June 28, 2011
The Backstory on Time-Share Computing
In chapter 4 of my Perl::PDQ book, "Linux Load Average—Take a Load Off" and Appendix B "A Short History of Buffers," I briefly refer to the history of Unix and ultimately Linux via Multics, starting with the original MIT project called CTSS (Compatible Time-sharing System). My purpose there was to point out that the load average metric is the earliest example of O/S performance instrumentation. Naturally then, the following 5-part series in the NYT on the development of time-share computers caught my attention:
These accounts are noteworthy because they are written by the brother of one of the developers (of early email—depending on how you define email) and the author is a journalist, so he interviewed some of the personalities (who are now getting on a bit).
There are also lots of fascinating photos.
These accounts are noteworthy because they are written by the brother of one of the developers (of early email—depending on how you define email) and the author is a journalist, so he interviewed some of the personalities (who are now getting on a bit).
There are also lots of fascinating photos.
Monday, June 27, 2011
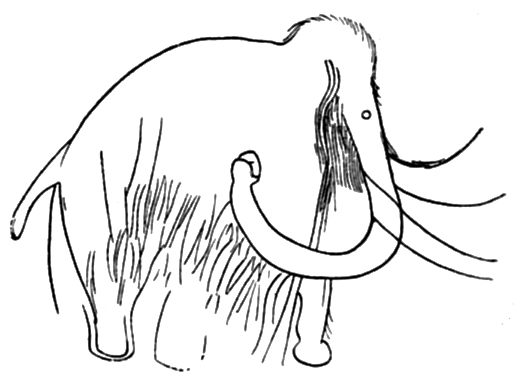
A Winking Pink Elephant
The title of chapter 5 in my Guerrilla Capacity Planning book is, "Evaluating Scalability Parameters," and underneath it you'll see this quote:

"With four parameters I can fit an elephant. With five I can make his trunk wiggle." —John von NeumannIn that vein, Guerrilla alumnus Stephen O'C. pointed me at a recent blog post and paper (PDF) that draws an elephantine curve using just 4 fitting coefficients or parameters. Stephen also sent me his translation of the Python code into R. Previous efforts apparently had required some 30 parameters. The secret to the success of this latest example is plotting the elephant in the complex plane by summing certain Fourier modes. That's all very cool but I was surprised to see that the output was static (no wiggles), even though 5 parameters are defined. That shortcoming, however, provided me with the impetus to try out R's animation package and here's the result.
Notice that my elephant not only wiggles his trunk but he also winks—a wiggling winking pink elephant. Actually, I think he looks more like a winking woolly mammoth. :)
Wednesday, June 22, 2011
Bit.ly Kung Fooz Itself
You know Bit Ly? Bruce Lee's distant cousin.
I love Twitter, but it's not for everybody and I can understand why some people don't get it or don't like it. One of the things I like is how the 140 char limit forces you to compose your tweet more carefully than you would in email or a blog. Tweeted URL links are counted as chars, so they can become a problem. Whether you use Twitter or not, there are occasions when you would like to replace some cosmologically long URL, like this http://maps.google.com/maps?q=27%C2%B09%E2%80%B236.73%E2%80%B3S+70%C2%B029%E2%80%B248.4%E2%80%B3W+&hl=en&ie=UTF8&ll=-27.268058,-70.423737&spn=0.330804,0.558929&sll=37.0625,-95.677068&sspn=37.819897,72.158203&t=h&z=11 with this http://j.mp/dmYEHy. That's where URL shorteners come in and there are many shortening services out there.
Until very recently, I had settled on using j.mp exclusively for Twitter because it was the first service I became aware of that produced the shortest URLs without going to unicode. j.mp is owned by bit.ly. With the recent advent of Twitter auto-shortening, bit.ly seems to be scrambling to keep users and in that process I suddenly noticed j.mp was now being redirected to bit.ly, which is not as short.
Moreover, j.mp was taking much more time to process a URL due to the growing JS eye-candy on their web page, not to mention "processing" your data. I can really see this with my web client bloat-detector: a 1 GHz Power Mac G4.
Finally, I decided to give bit.ly the chop in favor of goo.gl. Here's why:
- Not as short as j.mp but generally shorter than Tweeter's auto-shortner
- Tweeter auto-shortner can leave fairly explicit URL fragments
- Sometimes I don't want to divert attention with the longer Twitter URL string
- It has much lower JS overhead (Goog KISSes it) which makes for faster translation
- Goog doesn't need to riffle my wallet for this service
- Goog was tracking my data anyway :/
Monday, June 20, 2011
Bye Bye Mr. Bar Code
Last week, there was a New York Times obituary for Alan Haberman, he being the person who ushered in the barcode. Notice that's usher and not invent. That distinction goes to Norman Woodland and Bernard Silver, two graduate students at the Drexel Institute of Technology (now Drexel University), and was based—perhaps not surprisingly—on Morse code, which is now defunct.

Queueing at a grocery checkout [Source: Perl PDQ 2nd edn]
The bar code was an effort to modernize the grocery industry, which dates back to the 1940s. Woodland and Silver received a patent in 1952, but because scanning technology was rather poor at that time, their invention went largely unused. And that's where Alan Haberman comes in because he championed its adoption in actual retail stores. The first product to be purchased using a barcode, chewing gum no less, took place in 1974 at Marsh Supermarket in Troy, Ohio,
All of which brings me to the point of this post. Not only do I tend to use the grocery store as a familiar example of queueing effects, both in my Guerrilla CaP classes and my Perl::PDQ book, but Jim Holtman, one of our GDAT instructors, is currently doing data analysis and simulations for Kroger Supermarket in Cincinnati, Ohio. What is it with Ohio and grocery stores?
What started with barcodes, continues today with the application of RFID, motion capture, shelf optimization and so forth. And all these performance improvements rely on analyzing big data sets. No doubt, Jim will recount some of this in the upcoming GDAT class. You could do worse than be there for that. You can even bring your own data to be scanned and we'll check it out for you. :)
Tuesday, June 14, 2011
Two Heads Are Better Than One ... And m
In the GCaP class, one of the homework exercises refers to a grocery store checkout where the customer arrival rate is 1 customer every 2 minutes and the mean service time for the cashier to ring up groceries is 1.5 minutes. The first question is: What is the mean residence time for each customer?

From Little's law, the utilization of the cashier is ρ = λ S = 0.5 × 1.5 = 0.75 or 75%. The residence time is given by R1 = S/(1 − ρ) = 6.0 minutes.

From Little's law, the utilization of the cashier is ρ = λ S = 0.5 × 1.5 = 0.75 or 75%. The residence time is given by R1 = S/(1 − ρ) = 6.0 minutes.
Tuesday, May 31, 2011
Go Guerrill-R on Your Data
The Guerrilla Data Analysis Techniques training course (GDAT) will be held during the week of August 8-12 this year. As usual, the focus will be on applying R to your performance and capacity planning data, as well as how to use the PDQ-R modeling tool.

(Click on the image for details)
Classes are held at our Larkspur Landing location in Pleasanton, California; a 45-minute BART ride to downtown San Francisco. For those of you coming from international locations, here is a table of currency EXCHANGE rates. We look forward to seeing all of you in August!
Thursday, May 26, 2011
Quantifying Scalability FTW (The Movie)
The video of my presentation at the Surge 2010 conference on scalability and performance has finally been posted. Since it doesn't seem to be a streaming server, it may take several minutes to download the video (depending on the speed of your pipe). Also, the audio is suboptimal because it seems to have been recorded from the ambient loudspeakers rather than a direct mic. I was too busy giving the talk to remember the setup they used.
Here's the abstract:
Here's the abstract:
You probably already collect performance data, but data ain't information. Successfull scalability requires transforming your data so that you can quantify the cost-benefit of any architectural decisions. In other words:
measurement + models == information
So, measurement alone is only half the story; you need a method to transform your data. In this presentation I will show you a method that I have developed and applied successfully to large-scale web sites and stack applications to quantify the benefits of proposed scaling strategies. To the degree that you don't quantify your scalability, you run the risk of ending up with WTF rather than FTW.
Monday, May 23, 2011
May 2011 Guerrilla Classes: Light Bulb Moments
It's impossible to know what will constitute a light bulb moment for someone else. In the recent Guerrilla classes (GBoot and GCaP), we seemed to be having many more than our usual quota of such moments. So much so, that I decided to keep a list.
Thursday, May 19, 2011
Applying PDQ in R to Load Testing
PDQ is a library of functions that helps you to express and solve performance questions about computer systems using the abstraction of queues. The queueing paradigm is a natural choice because, whether big (a web site) or small (a laptop), all computer systems can be represented as a network or circuit of buffers and a buffer is a type of queue.
Sunday, May 1, 2011
Fundamental Performance Metrics
Baron Schwartz invited me to comment on his latest blog post entitled "The four fundamental performance metrics," which I did.
Coincidentally, I happened to address this same topic in my presentation at CMG Atlanta last week. As the following slides shows, I claim there are really only 3 fundamental performance metrics (actually 2, if you want to get truly fundamental about it).


Tuesday, April 19, 2011
PC and Netbook Sales Drop
During my Guerrilla classes, I like to make a point of reminding people that it's not enough to just focus on speeds and feeds and examining performance data. It's also important to take time out to check what's happening in the marketplace because current events there can have a huge impact on your performance analysis and capacity plans later on.
Case in point:
The news about Netbooks didn't come as a complete surprise to me because I had already decided they were a losing proposition in 2009. The thing to track now is the impact on Intel and Microsoft.
Case in point:
Acer, the number-three PC maker in the world, told investors this morning that second-quarter sales will be down 10% from last year. That's more bad news for PC suppliers like Microsoft and Intel.[Source: Business Insider]
...
The company has been hammered as netbook sales dried up, replaced in part by Apple's iPad.
The news about Netbooks didn't come as a complete surprise to me because I had already decided they were a losing proposition in 2009. The thing to track now is the impact on Intel and Microsoft.
Thursday, March 24, 2011
CMG Atlanta: Southbound for the Deep South

I will be at the CMG Greater Atlanta Spring conference on April 27, 2011. I was asked to cover something for both veterans and newcomers to capacity planning—along the lines of my Guerrilla Boot Camp classes. So, here's what I came up with.
Guerrilla CaP for Noobs and Nerds
Whether you're a newbie (noob) or a veteran (nerd) when it comes to capacity planning (CaP) and performance analysis, it never hurts to revisit the fundamentals. However, some CaP concepts that are touted as fundamental are actually myths. Here are some myths I hear all too often.
What's NOT:
During my twin session I will take these myths apart to expose the facts in terms of
- We don't need no stinkin' CaP, just more cheap servers.
- CPU utilization should never exceed 70% busy.
- A well-consolidated server should have no idle cycles.
- Throughput and latency are independent metrics that must be measured separately.
- Optimal response time is achieved at the knee of the curve.
- If you can measure it, you can manage it.
What's HOT†:
Along the way, I'll offer some Guerrilla mantras, as seen in my Guerrilla book and generated automatically on Twitter. You can use them as weapons of mass instruction to bust any other myths held by your colleagues and managers, whether you're a noob or nerd.
- If the app is single-threaded, a boat-load of cheap servers from China won't help.
- A 64-way server running 70% busy is 25% underutilized.
- A consolidated server may need to be under 10% busy to meet app SLAs.
- Throughput and latency are inversely related ... always!
- Response time knees are an optical illusion.
- All performance measurements are wrong by definition.
† With apologies to Paris Hilton.
Wednesday, March 16, 2011
PDQ Models: Show Me the Code
During a recent exchange with a potential PDQ user, that occurred as a sequence of blog comments related to my earlier post about getting started wtih PDQ, I thought we were very close to converging on the appropriate queueing model for his problem, and that it would make a nice addition to the models discussed in my Perl::PDQ book. In fact, I thought the model looked like this

which involves a feedback flow of requests to the Authent-ification server.
Wednesday, March 9, 2011
Hotsos 2011: Brooks, Cooks, Delay and This Just In ...
Thanks to all those who attended my presentation and offered me their compliments afterwards. It was a bit rushed and went a bit wobbly when it came to the description of the repairman queueing model (the Apple Genius Bar), but I knew that might happen going in. Despite my best efforts to muddle it at times, it seems people were able to take away a coherent (pun!) message. That was also evident from the excellent audience questions, as well as some of the tweets I've seen. Thank you.


Tuesday, March 8, 2011
Hotsos 2011: Mine the GAPP
It's that time of year again so, here I am in Dallas to present "Brooks, Cooks, and Response Time Scalability," where I will be showing how my universal scalability law (USL) can be applied to quantifying response-time scaling; as opposed to the more typical throughput scaling.
Friday, February 4, 2011
USL Fine Point: Sub-Amdahl Scalability
As discussed in Chapter 4 of my GCaP book, Amdahl's law is defined by a single parameter called the serial fraction, denoted by the symbol α and signifying the proportion of the total workload (W) that is serialized during execution. From the standpoint of parallel processing (where reference to Amdahl's law is most frequent) serialization means that portion of the workload can only execute on a single processor out of N parallel processors. The parallel speedup or relative capacity CA(N) performance metric is given by:
\begin{equation}
C_A(N) = \frac{N}{1 + \alpha \, (N-1)}
\end{equation}
If there is no serialization in the workload, i.e., α = 0, then CA(N) = N, which signifies that the workload scales linearly with the number of physical processors. The important observation made by Gene Amdahl (more than 40 years ago) is that even if α is relatively small, viz., a few percent of the execution time, scalability cannot continue to increase linearly. For example, if α = 5%, then CA(N) will eventually reach a scalability ceiling given by 20 effective processors (1/α), even if there are hundreds of physical processors available in the system.
Thursday, January 27, 2011
Idleness Is Not Waste
A common fallacy is to view all idle CPU cycles as wasted server capacity. It's not unusual for management and various bean-counters to display a reluctance to procure new hardware if unused cycles are clearly observable on existing hardware. This puts the pressure on sys admins to reduce idleness. Such is often the case during consolidation efforts: cram as many apps as possible onto a server to soak up every remaining CPU cycle.
 All performance analysis and capacity planning is essentially about optimizing resource usage under a particular set of constraints. The fallacy is treating maximization as optimization. This mistake is further exacerbated if only one performance metric, i.e., CPU utilization, is taken into account: a common situation promoted by the superficiality of performance dashboards. Maximization doesn't necessarily mean 100% utilization, either. The same is true even if some amount of CPU capacity is retained as headroom for workload growth. The tendency to "redline" it can still prevail.
You can't optimize a single number. Server utilization has to be optimized with respect to other measures, e.g., application response-time targets. We know from simple queueing theory that response time increases nonlinearly (the proverbial "hockey stick") with increasing server utilization. If the response-time goals are being met at 10% CPU busy, pre-consolidation, then almost certainly they will be exceeded at higher CPU utilization, post-consolidation. The response-time metric is an example of a cost that has to be taken into account to satisfy all the constraints of the optimized capacity plan.
Maximizing server utilization is as foolhardy as maximizing revenue. Both goals look attractive on their face, but if you don't keep track of outgoing CapEx and OpEx costs incurred to generate revenue, you could lose the company!
Wednesday, January 26, 2011

Subscribe to:
Posts (Atom)