In chapter 4 of my Perl::PDQ book, "Linux Load Average—Take a Load Off" and Appendix B "A Short History of Buffers," I briefly refer to the history of Unix and ultimately Linux via Multics, starting with the original MIT project called CTSS (Compatible Time-sharing System). My purpose there was to point out that the load average metric is the earliest example of O/S performance instrumentation. Naturally then, the following 5-part series in the NYT on the development of time-share computers caught my attention:
These accounts are noteworthy because they are written by the brother of one of the developers (of early email—depending on how you define email) and the author is a journalist, so he interviewed some of the personalities (who are now getting on a bit).
There are also lots of fascinating photos.
Tuesday, June 28, 2011
Monday, June 27, 2011
A Winking Pink Elephant
The title of chapter 5 in my Guerrilla Capacity Planning book is, "Evaluating Scalability Parameters," and underneath it you'll see this quote:

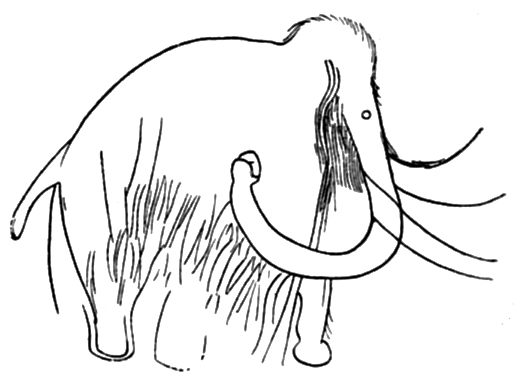
"With four parameters I can fit an elephant. With five I can make his trunk wiggle." —John von NeumannIn that vein, Guerrilla alumnus Stephen O'C. pointed me at a recent blog post and paper (PDF) that draws an elephantine curve using just 4 fitting coefficients or parameters. Stephen also sent me his translation of the Python code into R. Previous efforts apparently had required some 30 parameters. The secret to the success of this latest example is plotting the elephant in the complex plane by summing certain Fourier modes. That's all very cool but I was surprised to see that the output was static (no wiggles), even though 5 parameters are defined. That shortcoming, however, provided me with the impetus to try out R's animation package and here's the result.
Notice that my elephant not only wiggles his trunk but he also winks—a wiggling winking pink elephant. Actually, I think he looks more like a winking woolly mammoth. :)
Wednesday, June 22, 2011
Bit.ly Kung Fooz Itself
You know Bit Ly? Bruce Lee's distant cousin.
I love Twitter, but it's not for everybody and I can understand why some people don't get it or don't like it. One of the things I like is how the 140 char limit forces you to compose your tweet more carefully than you would in email or a blog. Tweeted URL links are counted as chars, so they can become a problem. Whether you use Twitter or not, there are occasions when you would like to replace some cosmologically long URL, like this http://maps.google.com/maps?q=27%C2%B09%E2%80%B236.73%E2%80%B3S+70%C2%B029%E2%80%B248.4%E2%80%B3W+&hl=en&ie=UTF8&ll=-27.268058,-70.423737&spn=0.330804,0.558929&sll=37.0625,-95.677068&sspn=37.819897,72.158203&t=h&z=11 with this http://j.mp/dmYEHy. That's where URL shorteners come in and there are many shortening services out there.
Until very recently, I had settled on using j.mp exclusively for Twitter because it was the first service I became aware of that produced the shortest URLs without going to unicode. j.mp is owned by bit.ly. With the recent advent of Twitter auto-shortening, bit.ly seems to be scrambling to keep users and in that process I suddenly noticed j.mp was now being redirected to bit.ly, which is not as short.
Moreover, j.mp was taking much more time to process a URL due to the growing JS eye-candy on their web page, not to mention "processing" your data. I can really see this with my web client bloat-detector: a 1 GHz Power Mac G4.
Finally, I decided to give bit.ly the chop in favor of goo.gl. Here's why:
- Not as short as j.mp but generally shorter than Tweeter's auto-shortner
- Tweeter auto-shortner can leave fairly explicit URL fragments
- Sometimes I don't want to divert attention with the longer Twitter URL string
- It has much lower JS overhead (Goog KISSes it) which makes for faster translation
- Goog doesn't need to riffle my wallet for this service
- Goog was tracking my data anyway :/
Monday, June 20, 2011
Bye Bye Mr. Bar Code
Last week, there was a New York Times obituary for Alan Haberman, he being the person who ushered in the barcode. Notice that's usher and not invent. That distinction goes to Norman Woodland and Bernard Silver, two graduate students at the Drexel Institute of Technology (now Drexel University), and was based—perhaps not surprisingly—on Morse code, which is now defunct.

Queueing at a grocery checkout [Source: Perl PDQ 2nd edn]
The bar code was an effort to modernize the grocery industry, which dates back to the 1940s. Woodland and Silver received a patent in 1952, but because scanning technology was rather poor at that time, their invention went largely unused. And that's where Alan Haberman comes in because he championed its adoption in actual retail stores. The first product to be purchased using a barcode, chewing gum no less, took place in 1974 at Marsh Supermarket in Troy, Ohio,
All of which brings me to the point of this post. Not only do I tend to use the grocery store as a familiar example of queueing effects, both in my Guerrilla CaP classes and my Perl::PDQ book, but Jim Holtman, one of our GDAT instructors, is currently doing data analysis and simulations for Kroger Supermarket in Cincinnati, Ohio. What is it with Ohio and grocery stores?
What started with barcodes, continues today with the application of RFID, motion capture, shelf optimization and so forth. And all these performance improvements rely on analyzing big data sets. No doubt, Jim will recount some of this in the upcoming GDAT class. You could do worse than be there for that. You can even bring your own data to be scanned and we'll check it out for you. :)
Tuesday, June 14, 2011
Two Heads Are Better Than One ... And m
In the GCaP class, one of the homework exercises refers to a grocery store checkout where the customer arrival rate is 1 customer every 2 minutes and the mean service time for the cashier to ring up groceries is 1.5 minutes. The first question is: What is the mean residence time for each customer?

From Little's law, the utilization of the cashier is ρ = λ S = 0.5 × 1.5 = 0.75 or 75%. The residence time is given by R1 = S/(1 − ρ) = 6.0 minutes.

From Little's law, the utilization of the cashier is ρ = λ S = 0.5 × 1.5 = 0.75 or 75%. The residence time is given by R1 = S/(1 − ρ) = 6.0 minutes.
Subscribe to:
Posts (Atom)