Thursday, January 31, 2013

Modem Memories Decoded

If you've ever used a phone line to connect to the Internet or sent a fax, you're familiar the racket that precedes the actual data transmission. Not exactly a Beethoven symphony. Even if you are very familiar with the sounds and know it's "handshaking" with the other modem in order to create a comms channel, you probably don't know precisely what is going on with all that warbling and hissing.

Oona Räisänen (windytan) has put together a very nice annotated sonogram and explanation on her blog. That the whole thing sounds more like bursting artillery shells than dueling banjos is partly a result of the protocol trying to defeat sophisticated circuitry for noise cancellation and echo suppression on the telephone network.

Wednesday, January 23, 2013

Going Beyond Florence Nightingale's Data Diagram: Did Flo Blow It with Wedges?

In 2010, I wrote a short blog item about Florence Nightingale the statistician, solely because of its novelty value. I didn't even bother to look closely at the associated graphic she designed, but that's what I intend to do here. In this first installment, I reflect on her famous data visualization by reconstructing it with the modern tools available in R. In part two, I will use the insight gained from that exercise to go beyond data presentation to potentially more revealing data modeling. Interestingly, I suspect that much of what I will present could also have been accomplished in Florence Nightingale's day, more than 150 years ago, albeit not as easily and not by her alone.

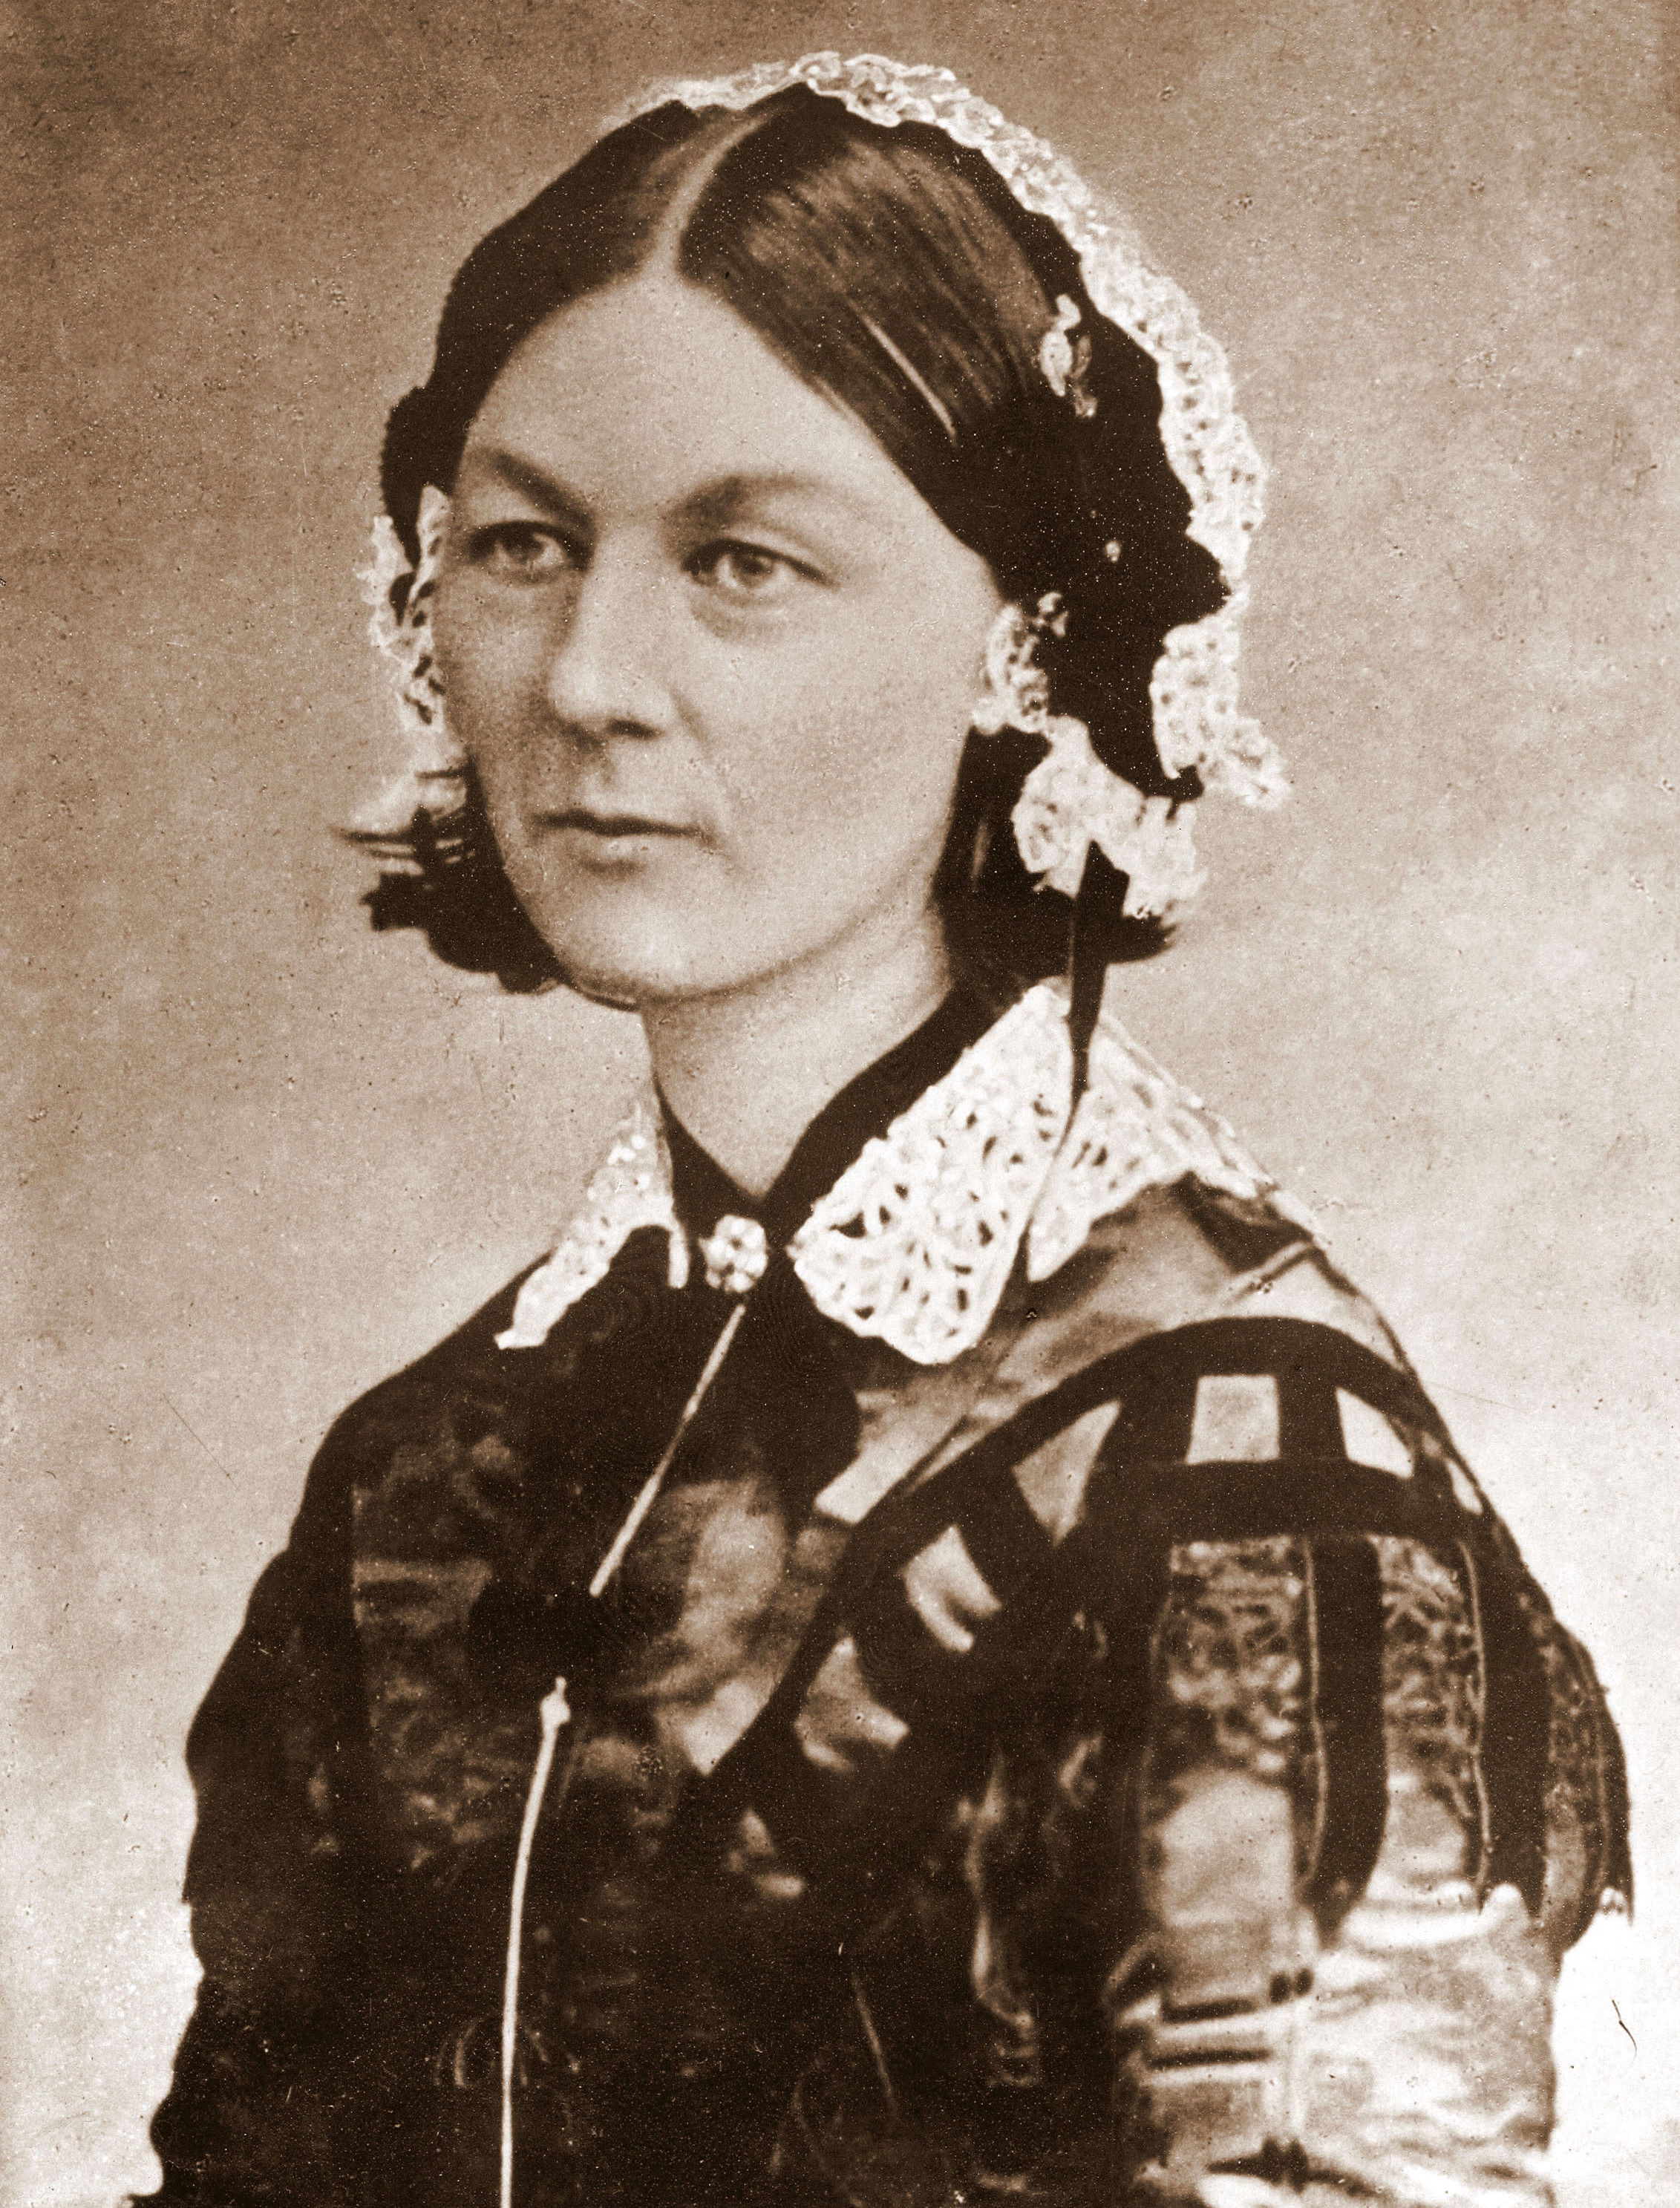
Figure 1. Nightingale and her data visualization (click to enlarge)

Although Florence Nightingale was not formally trained as a statistician, she apparently had a natural aptitude for mathematical concepts and evidently put a lot of thought into presenting the import of her medical findings in a visual way. Click on Figure 1 to enlarge it and view the details in her original graphic. As a consequence, she was elected the first female member of the Royal Statistical Society in 1859 and later became an honorary member of the American Statistical Association.

Why Wedges?

Why did FN bother to construct the data visualization in Figure 1? If you read her accompanying text, you see that she refers to the sectors as wedges. In a nutshell, her point in devising Figure 1 was to try and convince a male-dominated, British bureaucracy that better sanitary methods could seriously diminish the adverse impact of preventable disease amongst military troops on the battlefield. The relative size of the wedges is intended to convey that effect. Later on, she promoted the application of the same sanitation methodologies to public hospitals. She was using the established term of the day, zymotic disease, to refer to epidemic, endemic, and contagious diseases.

Friday, January 18, 2013

Linux Per-Entity Load Tracking: Plus ça change

Canadian capacity planner, David Collier-Brown, pointed me at this post about some more proposed changes to how load is measured in the Linux kernel. He's not sure they're on the right track. David has written about such things as cgroups in Linux and I'm sure he understands these things better than I do, so he might be right. I never understood the so-called CFS: Completely Fair Scheduler. Is it a fair-share scheduler or something else? Not only was there a certain amount of political fallout over CFS but, do we care about such things anymore? That was back in 2007. These days we are just as likely to run Linux in a VM under VMware or XenServer or the cloud. Others have proposed that the Linux load average metric be made "more accurate" by including IO load. Would that be local IO, remote IO or both? Disk IO, network IO, etc., etc?

Monday, January 14, 2013

The Social Network Ranking is Wrong

Call me old-fashioned, but I never saw the 2010 movie The Social Network until last year (at a private screening). In case you also missed it, it's the Hollywood version of how Facebook.com came into being.

Quite apart from any artistic criticisms, I have a genuine psychological problem with movies like TSN. I keep getting caught up in technical inaccuracies and tend to lose the plot. So, it's very hard for me to watch such movies as the director intended. It's the same reason I can't stand SciFi movies or books: I can't get past the impossible and the just plain wrong. It turns out that TSN is generally fairly accurate regarding things like Linux, MySQL, PHP, and so forth, but there is a real clanger: the ranking algorithm used by Facemash—the Facebook precursor.

There's a scene where the Mark Zuckerberg character wants to rank Harvard women based on crowd-sourced scores. He recalls that his best friend (at the time), Eduardo Saverin, had previously mentioned a ranking formula, but Zuck can't remember how it goes, so he can't code it. When Saverin shows up again, Zuck urgently asks him to reveal it. In typical Hollywood style—possibly to keep a generally math-phobic audience visually engaged—Saverin writes the ranking equations on the dorm window (see above image) for the desperate Zuckerberg. Where else would you write equations?

Here they are, reproduced with a little better formatted: \begin{align} Ea &= \dfrac{1}{1 + 10 (Rb-Ra)/400}, & Eb &= \dfrac{1}{1 + 10 (Ra-Rb)/400} \label{eqn:movie} \end{align} There's just one slight problem: they're wrong!

Friday, January 11, 2013

Oracle Java 7 Security Vulnerability

National Cyber Awareness System

US-CERT Alert TA13-010A
Oracle Java 7 Security Manager Bypass Vulnerability

Original release date: January 10, 2013

Systems Affected

Any system using Oracle Java 7 (1.7, 1.7.0) including
  • Java Platform Standard Edition 7 (Java SE 7)
  • Java SE Development Kit (JDK 7)
  • Java SE Runtime Environment (JRE 7)
All versions of Java 7 through update 10 are affected. Web browsers using the Java 7 plug-in are at high risk.

Sunday, January 6, 2013

Visualizing Variance

The typical presentation of variance in textbooks often looks like this Wikipedia definition. Quite daunting for the non-expert. So, how would you explain the notion of variance to someone who has little or no background in statistics and couldn't easily digest all that gobbledygook?

The Mean

Let's drop back a notch. How would you explain the statistical mean? A common way to do that is to utilize the simple visual device of the "bell curve" belonging to the normal distribution (Fig. 1).

Figure 1. A normal distribution

The normal distribution, $N(x,\mu,\sigma^2)$, is specified by two parameters:

  1. Mean, usually denoted by $\mu$
  2. Variance, usually denoted by $\sigma^2$
that determine (1) the location and (2) the shape of the curve. In Fig. 1, $\mu = 4$. Being a probability, the curve must be normalized to enclose unit area. Also, since $N(x)$ is unimodal and symmetric about $\mu$, the mean, median and mode are all located at the same position on the $x$-axis. Therefore, it's easy to point to the mean as being the $x$-position of the peak. Anybody can see that immediately. Mission accomplished.

But what about the variance? Where is that in Figure 1?